Key Takeaways
- The problem: An agent can return HTTP 200 on every call — healthy by every infrastructure metric — while quietly producing wrong outputs for weeks before anyone notices.
- Why it matters: “The service is healthy” and “the system is right” are different questions. Traditional monitoring only answers the first one.
- What you’ll learn: Four LLMOps observability patterns that give you real production signal — trace-level reasoning capture, cost attribution, output drift detection, and alerting that surfaces problems before users do.
Post 7 designed the multi-agent architecture. Now you have to operate it. And this is where most teams learn a hard lesson: logging isn’t observability.
Logging captures what happened. Observability lets you ask questions you didn’t know you needed to ask before the failure.
I’ve seen this play out where the first signal wasn’t from any dashboard — it was a message from a customer saying “the summaries feel off lately.” No errors. No latency spike. No alert fired. The agent was returning HTTP 200 on every call and producing responses that passed every structural check. What it was doing: quietly truncating the most critical part of each support ticket — the customer’s stated urgency — because that information appeared late in the input and the context window was filling up from the other direction. Three weeks before anyone noticed.
That distinction matters more for LLMs than for any system you’ve run before.
“The service is healthy” and “the system is right” are different questions
Traditional monitoring answers one question: is the service up? Latency normal? Error rate within SLA?
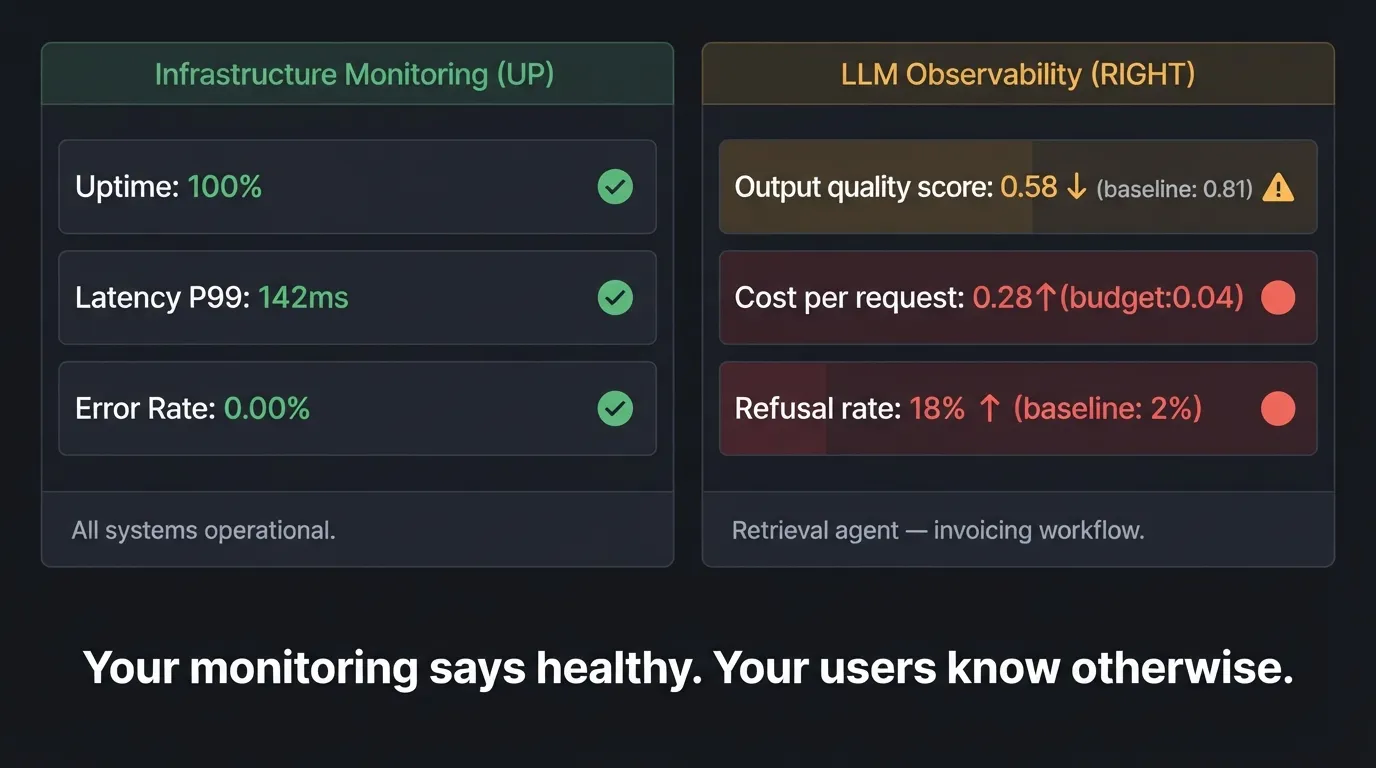
For agents, none of that tells you if the system is working. An agent can return HTTP 200 on every call while hallucinating invoice totals, refusing tasks it should complete, or burning 10x the expected token budget on a single user session. Infrastructure says healthy. Your users know otherwise.
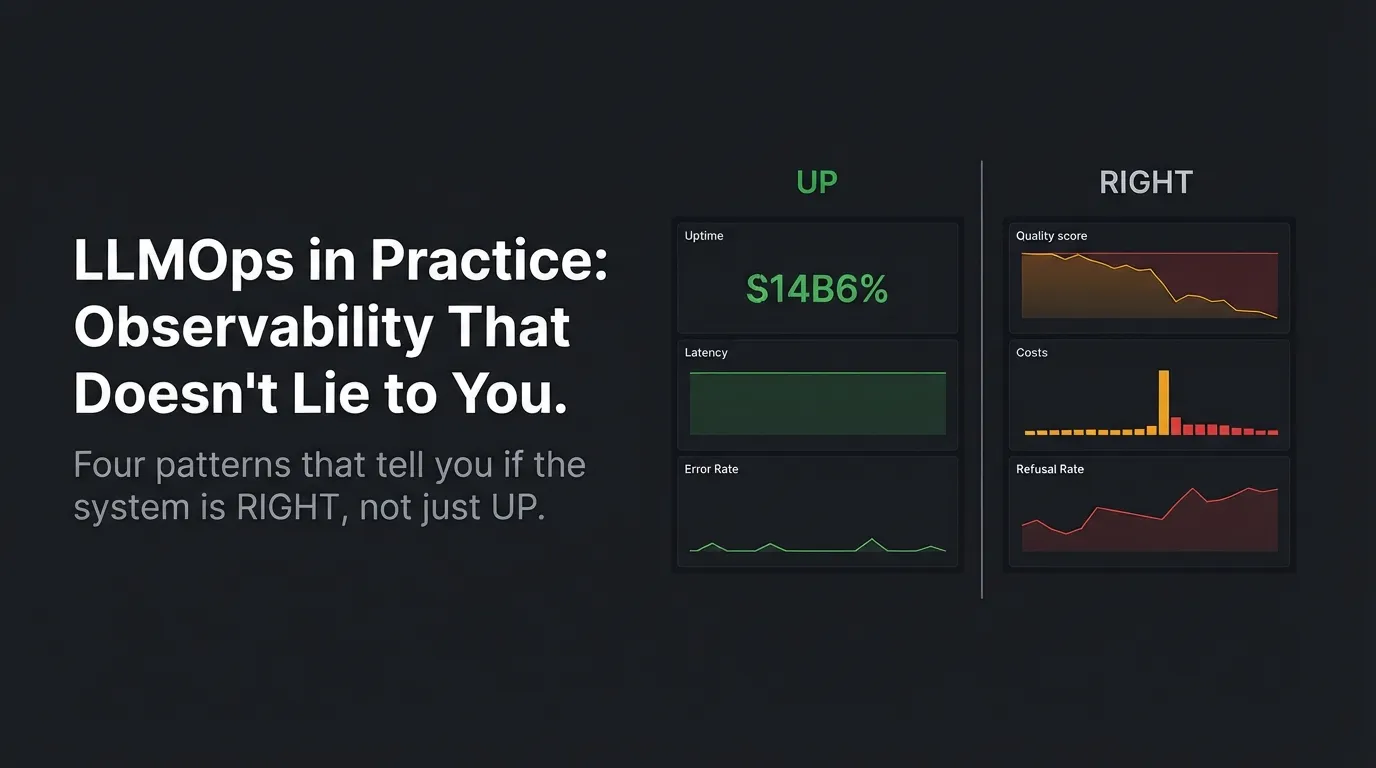
You need a different instrument. Not just a second dashboard — a second class of question. Traditional monitoring tells you if a system is UP. LLM observability needs to tell you if the system is RIGHT.
These are different problems.
Four places production AI systems lie to you — and how to catch them
1. Trace-level reasoning capture
For single LLM calls, input/output logging is enough to debug. For multi-step agents, it’s almost useless.
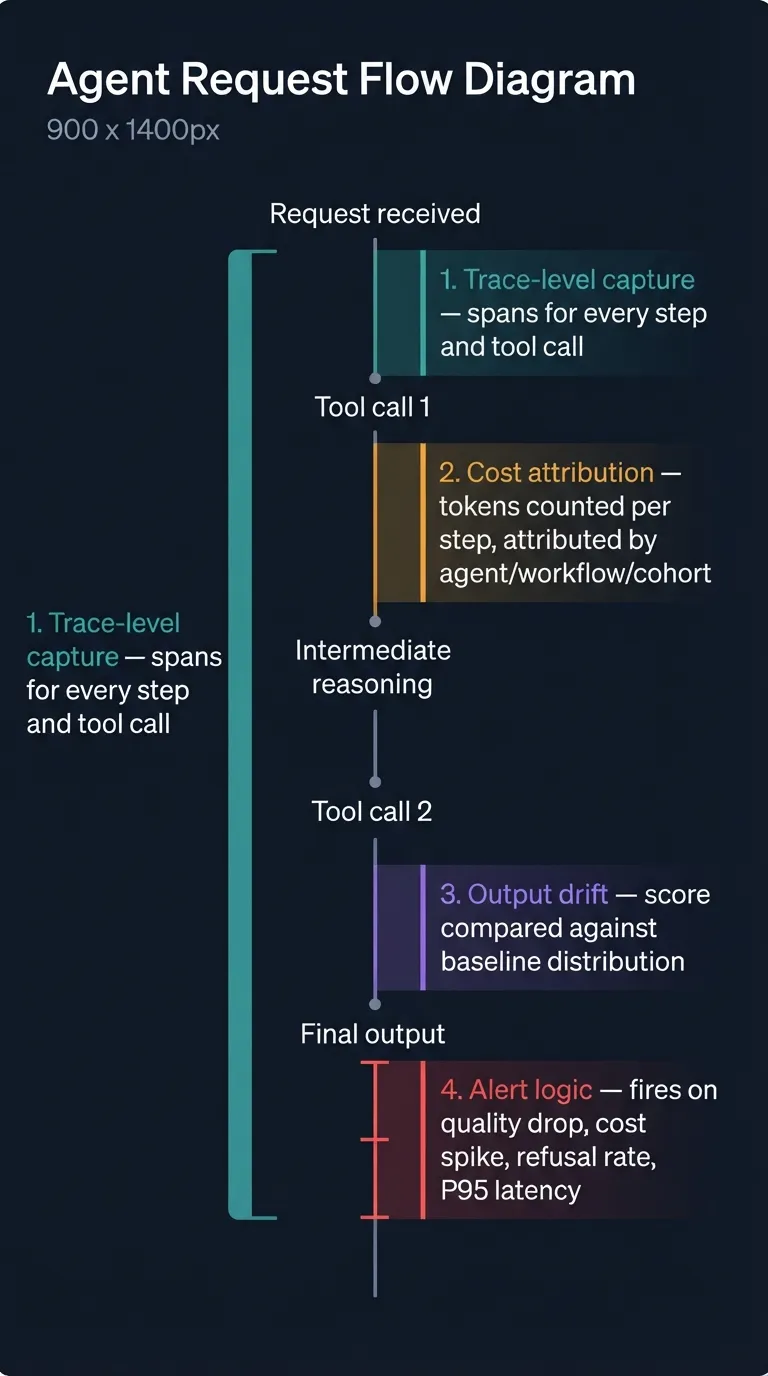
When an agent calls three tools, re-evaluates an intermediate result, loops back to a retrieval step, and finally produces an answer — the output alone tells you nothing about why it arrived there. You need the trace: every reasoning step, every tool invocation, every intermediate state.
This is the difference between knowing your agent said something wrong and knowing where in the reasoning chain it went wrong. The second is actionable. The first isn’t.
OpenTelemetry-compatible tracing — with spans for each agent step, each tool call, and each model invocation — is the minimum viable structure. Store the intermediate states, not just the terminal output.
Tracing also needs to extend to the protocol boundary. If an injected instruction in retrieved content tricks an agent into abusing a tool call, your traces need to surface that — not just log that a tool was invoked. Prompt Injection, MCP, and the Trust Boundary Problem covers how to design for that class of failure before it reaches production.
2. Cost attribution
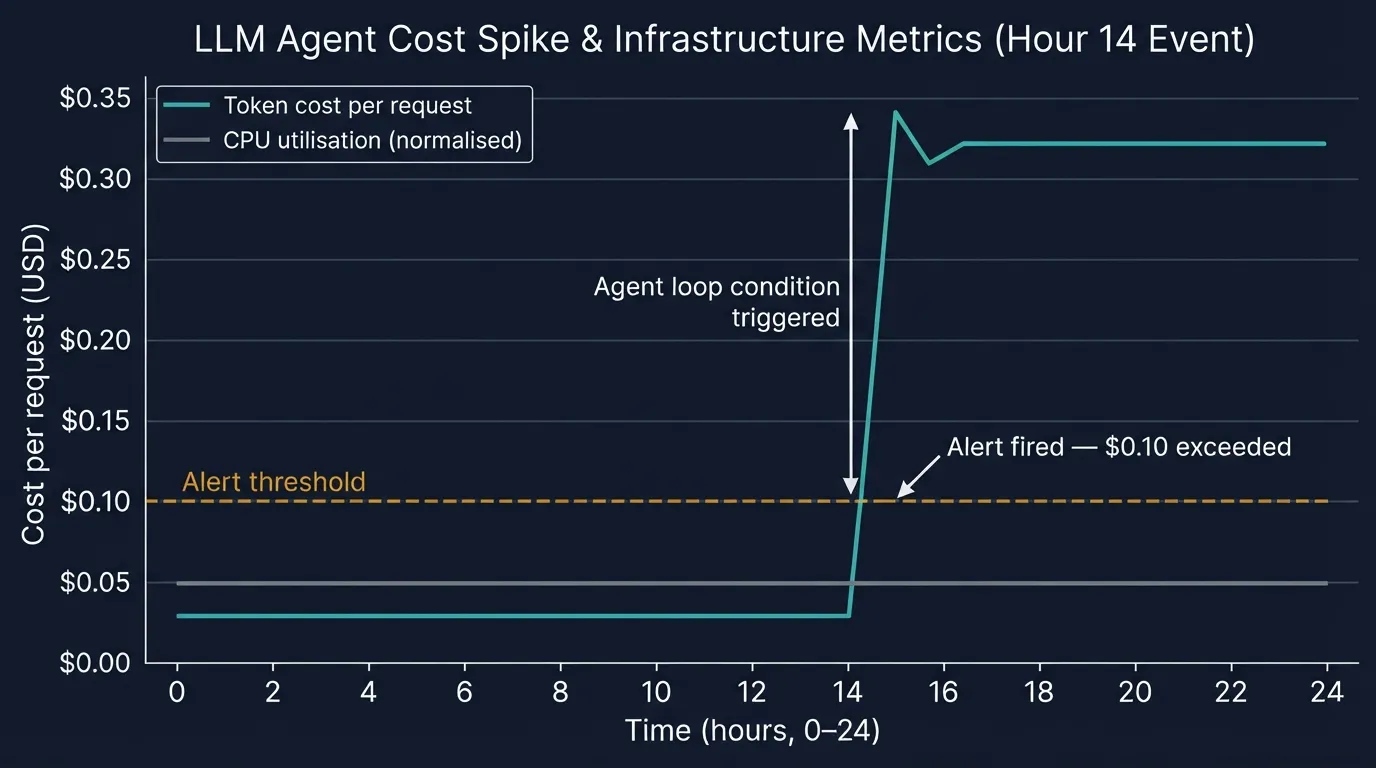
Token spend has no natural ceiling. A runaway agent loop — model calls a tool, tool result triggers re-evaluation, re-evaluation calls another tool — won’t trip a CPU alert. It will silently accumulate across hundreds of concurrent sessions before your billing dashboard shows anything unusual.
Cost attribution answers: which agent, which workflow, which user segment is driving the bill?
Without that breakdown, you can see you’re overspending. You can’t see where. And “we’re spending too much on tokens” is not an actionable incident response — “the document summarization agent for enterprise accounts is averaging 40k tokens per session against a budget of 8k” is.
Attribute costs at the request level. Aggregate by agent type, workflow stage, and user cohort. Alert on per-request anomalies before they become a monthly surprise.
3. Output drift detection
This one catches teams off guard because it’s silent.
You didn’t update the model. You didn’t change the system prompt. But something upstream shifted — a context window got longer, a retrieval index was refreshed, an upstream data schema changed — and the agent’s behavior is measurably different from last week.
Without output drift detection, you find out from a support ticket.
The instrument: baseline your agent’s output characteristics on a representative test set when you deploy. Track those characteristics over time in production — topic adherence, refusal rate, response length distribution, evaluator scores from your quality assessment model. Set alerts when distributions shift, not just when error rates spike. Drift is a leading indicator. Error rate is a lagging one.
4. Alerting that surfaces problems before users do
The easiest way to generate alert fatigue is to alert on everything. The easiest way to miss real incidents is to alert on nothing.
For LLM systems, the signals that actually matter are: output quality score dropping below baseline, cost-per-request exceeding a threshold by cohort, refusal rate spiking (often means a prompt regression or a retrieval failure), and latency at the 95th percentile — not mean latency, which masks tail problems.
The signals that create noise: individual token counts without context, raw response length, per-request latency for all requests (too volatile), and model confidence scores in isolation (they’re not calibrated the way you’d expect).
Alert on distributions and thresholds with context, not raw values.
A minimal tracing wrapper
You don’t need a full observability platform to start. This pattern captures what a team actually needs at the call level:
import time
import uuid
from dataclasses import dataclass, field
from typing import Any

@dataclass
class LLMTrace:
    trace_id: str = field(default_factory=lambda: str(uuid.uuid4()))
    agent_id: str = ""
    workflow: str = ""
    user_cohort: str = ""
    steps: list = field(default_factory=list)
    total_input_tokens: int = 0
    total_output_tokens: int = 0
    total_cost_usd: float = 0.0
    duration_ms: float = 0.0

def traced_llm_call(
    client,
    messages: list,
    agent_id: str,
    workflow: str,
    user_cohort: str,
    cost_per_1k_input: float = 0.003,
    cost_per_1k_output: float = 0.015,
) -> tuple[str, LLMTrace]:
    trace = LLMTrace(
        agent_id=agent_id,
        workflow=workflow,
        user_cohort=user_cohort,
    )

    start = time.monotonic()

    response = client.chat(messages=messages)  # your LLM client call here

    trace.duration_ms = (time.monotonic() - start) * 1000
    trace.total_input_tokens = response.usage.input_tokens
    trace.total_output_tokens = response.usage.output_tokens
    trace.total_cost_usd = (
        (trace.total_input_tokens / 1000) * cost_per_1k_input
        + (trace.total_output_tokens / 1000) * cost_per_1k_output
    )

    trace.steps.append({
        "type": "llm_call",
        "input_tokens": trace.total_input_tokens,
        "output_tokens": trace.total_output_tokens,
        "duration_ms": trace.duration_ms,
    })

    # Emit to your observability backend here (OTLP, Datadog, custom sink)
    # This trace structure is compatible with OpenTelemetry GenAI semantic conventions
    emit_trace(trace)

    # Cost anomaly alert — adjust threshold per workflow; a summarisation agent
    # and a real-time chat agent have very different baselines
    if trace.total_cost_usd > 0.10:
        alert(f"[{agent_id}] Cost anomaly: ${trace.total_cost_usd:.4f} "
              f"for trace {trace.trace_id} in {workflow} / {user_cohort}")

    return response.content, trace


def emit_trace(trace: LLMTrace):
    # Replace with your sink: OTLP exporter, structured log, database write
    print(f"TRACE | {trace.trace_id} | {trace.agent_id} | "
          f"{trace.workflow} | {trace.user_cohort} | "
          f"tokens={trace.total_input_tokens + trace.total_output_tokens} | "
          f"cost=${trace.total_cost_usd:.4f} | "
          f"duration={trace.duration_ms:.1f}ms")


def alert(message: str):
    # Replace with your alerting integration (PagerDuty, Slack, OpsGenie)
    print(f"ALERT: {message}")
This wrapper gives you: per-call cost attribution by agent, workflow, and user cohort; duration instrumentation; a cost threshold alert; and a structured trace ready to emit to any observability backend. Extend trace.steps for multi-step agents — append a record for each tool call and intermediate reasoning step before the final emit.
What good looks like: incidents before users file tickets
When you have these four patterns in place, incidents look different. Instead of “the agent is broken — page everyone,” you get: “the retrieval agent in the invoicing workflow for enterprise accounts has had a 23% output quality drop over the last 6 hours, coinciding with a 3x cost increase per request.” That’s an actionable diagnosis before a user files a ticket.
Observability is the difference between reacting to failures and finding them yourself. In production AI systems, that gap is measured in user trust.
Capturing execution traces helps debug behavior — but there’s a harder problem underneath: when developers stop understanding the AI-generated code they’re shipping, no trace can reconstruct that lost comprehension. The Cognitive Debt Crisis in AI-Augmented Codebases covers the accumulation mechanism and what the minimum viable intervention looks like.
Next: Observability tells you what’s happening inside the system. Deployment architecture determines where it runs — and that question is getting complicated. → Post 9: Cloud vs. On-Prem vs. Edge: The Decision Framework You Actually Need